Where are property prices reducing in London?
Rentround has analysed which areas in London have the most people looking to sell their property that have experienced price reductions & by how much they’ve dropped (since initial listing) – there are some notable discoveries.
Halifax this week published figures that showed in January property prices suffered their biggest fall since April last year.
Prices slipped by -0.3% in January across the UK, pushing property value down to its lowest level since October, at just under £252,000.
Adding to Londoners woes, The Times wrote this week about the exodus of workers impacting London property prices
The data is divided by area within London and it shows how many reduced properties are currently up for sale and by how much they’ve reduced by. We’ve removed towns that have less than 10 properties that have had their price reduced.
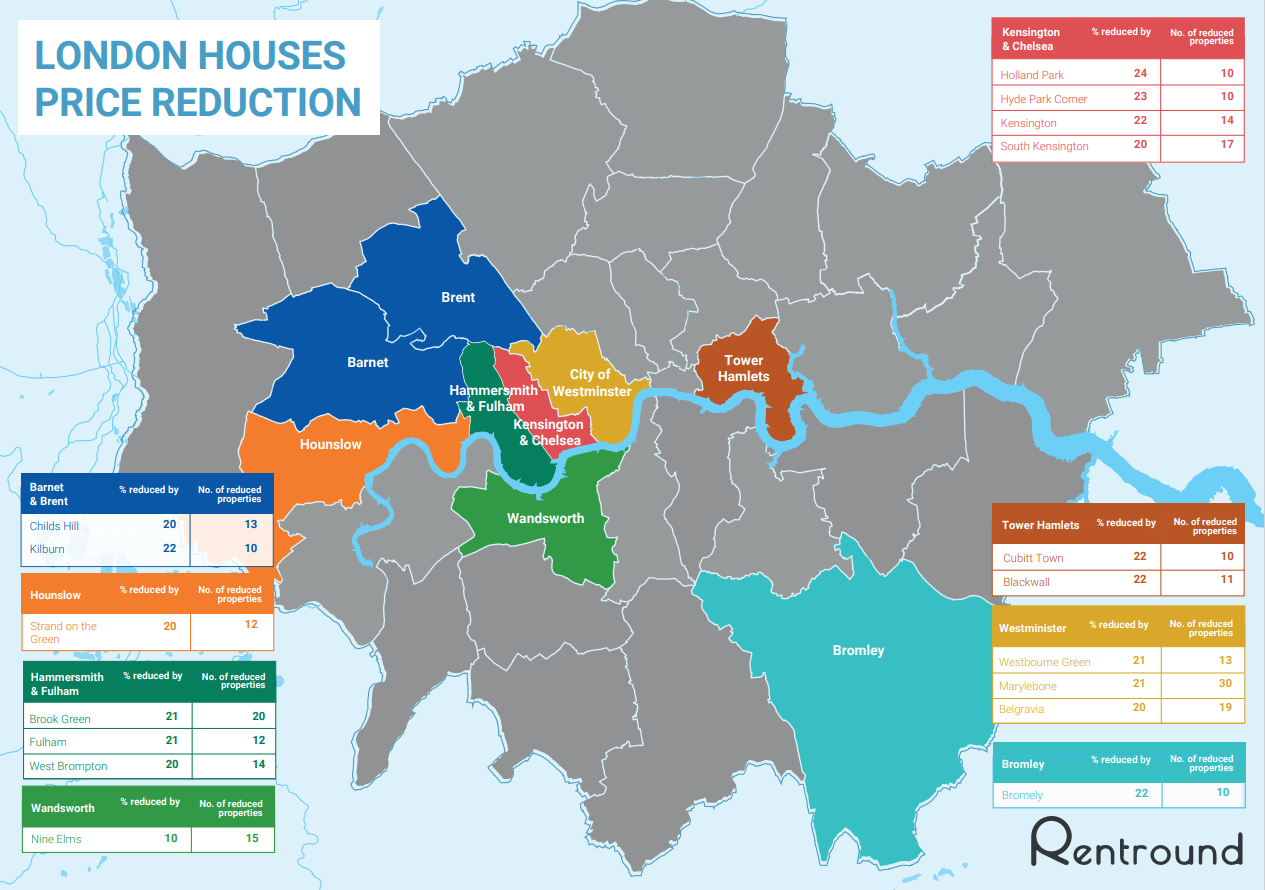
Table of where London houses have been reduced & their average reduction
The highest % reductions have been seen in Holland Park with properties that have been reduced since initial listing, dropping by an average of 24.
Holland Park isn’t the only badly hit area in Kensington and Chelsea. Hyde Park Corner, Kensington and South Kensington also have a high number of reduced properties
Notably, Paddington (37), Lisson Grove (31) and Marylbone (30) currently have the most properties for sale that have seen their initial asking price reduced.
| # | Town | % price has reduced by since first listing | Properties with reduced price since initial listing |
| 1 | Holland Park | 24 | 10 |
| 2 | Hyde Park Corner | 23 | 10 |
| 3 | Cubitt Town | 22 | 10 |
| 4 | Blackwall | 22 | 11 |
| 5 | Kilburn | 22 | 10 |
| 6 | Kensington | 22 | 14 |
| 7 | Brook Green | 21 | 20 |
| 8 | Westbourne Green | 21 | 13 |
| 9 | Marylebone | 21 | 30 |
| 10 | Fulham | 21 | 12 |
| 11 | West Brompton | 20 | 14 |
| 12 | Belgravia | 20 | 19 |
| 13 | Strand on the Green | 20 | 12 |
| 14 | Childs Hill | 20 | 13 |
| 15 | South Kensington | 20 | 17 |
| 16 | Bromley | 19 | 15 |
| 17 | Nine Elms | 19 | 15 |
| 18 | Brompton | 19 | 10 |
| 19 | Paddington | 19 | 37 |
| 20 | Bermondsey | 19 | 10 |
| 21 | St John’s Wood | 19 | 18 |
| 22 | Millbank | 19 | 15 |
| 23 | Croydon | 19 | 11 |
| 24 | Brentford | 19 | 10 |
| 25 | Stockwell | 19 | 11 |
| 26 | Bayswater | 19 | 29 |
| 27 | Richmond | 19 | 13 |
| 28 | Pimlico | 19 | 14 |
| 29 | Battersea | 19 | 13 |
| 30 | Chelsea | 18 | 20 |
| 31 | Shepherd’s Bush | 18 | 12 |
| 32 | Brixton | 18 | 11 |
| 33 | Sands End | 18 | 14 |
| 34 | Bloomsbury | 18 | 12 |
| 35 | Hammersmith | 18 | 16 |
| 36 | Clapham Junction | 18 | 10 |
| 37 | Earl’s Court | 18 | 11 |
| 38 | Vauxhall | 18 | 13 |
| 39 | Maitland Park | 18 | 21 |
| 40 | Church End | 18 | 10 |
| 41 | West Kensington | 17 | 26 |
| 42 | Belsize Park | 17 | 12 |
| 43 | Ealing | 17 | 16 |
| 44 | North Kensington | 17 | 13 |
| 45 | Lisson Grove | 17 | 31 |
Comments from Raj Dosanjh, Rentround founder
The property market is on edge at the moment. The stamp duty holiday duration, end of furlough, Brexit and working from home practices are creating a real risk to London property prices and rental amounts.
It’s unclear if the news from Halifax warrants panic at this stage, or if it’s just a blip. Nevertheless it’s another thing to worry about for London property owners & landlords.
The price reductions appear to be centred towards the West & North West of London, which will worry property owners & landlords in those areas.
In parallel to this news, January saw the highest number of London landlords using our platform to compare letting agents fees & services.
Our data shows that guaranteed rent is a service in demand. Searches for this service increased by 22% over the last quarter, indicating landlords are looking to lock in some of their rental income.
However many letting agents on Rentround have pulled back their guaranteed rent services, or increased their prices. Landlords looking to obtain the security this service provides in the midst of worker migrations out of London (which will impact rental income), may find it difficult.
