Rental Yields & Property Prices in the UK
New legislation, higher letting agent fees and tax increases, have made the past few years difficult for landlords and even the best of letting agents. For sure the latest stamp duty news will add much positivity to the rental market.
As the pandemic impact & government restrictions ease, buyers are now looking to jump back into the property market. With the stamp duty holiday, purchase prices & rental yield data will be analysed more than ever.

So where should you be looking to target the best yield areas?
Where do you get the cheapest properties with high yield returns?
On the flip side, where should you avoid if you’re looking for rental income?
The below data will hopefully help you find a great place to purchase a property to rent out, we’ve got all the data points covered.
1. Which areas have the best rental yields?
2. Which areas have the worst rental yields?
3. Which postcodes have the highest valued properties?
4. Where is the cheapest place to buy?
5. Cheapest place on average to rent?
6. Where are the highest volumes of sales?
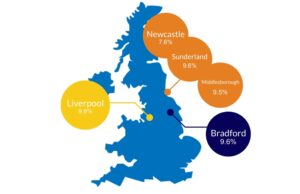
Which areas have the best rental yields?
Aside from the absence of London areas, there is one other surprising point to note in this table, which is the appearance of multiple Liverpool postcodes.
Liverpool is a hot spot for landlords looking to capitalise on high rental yields. 5 Liverpool postcodes make up the Top 20 best yield areas.
The highest position outside of England, is the Welsh area of Pontypridd, providing rental yields of 7.6%.
| # | Postcode | City/Town | Avg asking rent (pm) | Avg yield |
| 1 | L7 | Liverpool | 859 | 9.9 |
| 2 | BD1 | Bradford | 469 | 9.6 |
| 3 | SR1 | Sunderland | 525 | 9.6 |
| 4 | TS1 | Middlesbrough | 437 | 9.5 |
| 5 | NE6 | Newcastle | 783 | 7.6 |
| 6 | CF37 | Pontypridd | 789 | 7.6 |
| 7 | L1 | Liverpool | 721 | 7.5 |
| 8 | S1 | Sheffield | 696 | 7.4 |
| 9 | L5 | Liverpool | 599 | 7.4 |
| 10 | M14 | Manchester | 1,084 | 7.3 |
| 11 | DN31 | Grimsby | 432 | 7.3 |
| 12 | LS4 | Leeds | 1,075 | 7.3 |
| 13 | M11 | Greater Manchester | 850 | 7.1 |
| 14 | L2 | Liverpool | 757 | 6.9 |
| 15 | S3 | Sheffield | 627 | 6.9 |
| 16 | PR1 | Preston | 682 | 6.9 |
| 17 | NG1 | Nottingham | 874 | 6.8 |
| 18 | TS3 | Middlesbrough | 452 | 6.7 |
| 19 | L15 | Liverpool | 786 | 6.7 |
| 20 | IP27 | Lakenheath | 1,149 | 6.6 |
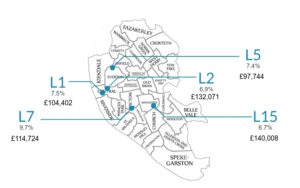
Liverpool, King of the North
With Liverpool so dominant, it’s only fair we give the city some more attention.
L7, L1, L5, L2 and L15 indicate are the prime areas in the city, for landlords to capitalise on and gain the best rental yields.
On the below infographic showing the best rental yield postcodes in Liverpool, we’ve also included the average purchase prices in the areas.
Which areas have the worst rental yields?
As you would expect, with the absence of London postcodes in the top 20 table, they make up a large proportion of the worst yield locations. The top 5 worst performing areas are made up of London postcodes.
The data isn’t likely to be shocking if you follow the property market with a keen eye regularly.
Over the last few years London has been notorious for its low rental yields, with Landlords opting for the higher capital growth and seemingly resilience to economic downturns.
With London house prices growing more than twice as fast as the rest of the UK, the below data doesn’t exactly represent doom & gloom for London property owners.
| # | Postcode | City/Town | Avg asking rent (pm) | Avg yield |
| 1 | W1 | London | 2,698 | 1.6 |
| 2 | SW7 | London | 2,996 | 1.7 |
| 3 | RG10 | Waltham Saint Lawrence | 978 | 1.8 |
| 4 | CM4 | Ingatestone | 944 | 1.8 |
| 5 | SW3 | London | 2,654 | 1.9 |
| 6 | HP9 | Beaconsfield | 1,664 | 1.9 |
| 7 | SY13 | Whitchurch | 541 | 1.9 |
| 8 | W8 | London | 2,820 | 2 |
| 9 | OX13 | Kingston Bagpuize | 882 | 2 |
| 10 | WC2 | London | 2,683 | 2.1 |
| 11 | SW1 | South London | 2,595 | 2.1 |
| 12 | HR9 | Ross-on-Wye | 627 | 2.1 |
| 13 | N6 | London | 1,581 | 2.2 |
| 14 | AL5 | Harpenden | 1,393 | 2.2 |
| 15 | HR8 | Ledbury | 676 | 2.2 |
| 16 | HR6 | Leominster | 544 | 2.2 |
| 17 | NW8 | London | 2,453 | 2.3 |
| 18 | SW10 | London | 2,352 | 2.3 |
| 19 | W11 | London | 2,290 | 2.3 |
| 20 | NW11 | London | 1,687 | 2.3 |
Which postcodes have the highest valued properties?
Of course, the main antagonists in this list are mostly London postcodes.
SW7 poses an average asking price of over £2.16m! This is closely followed by it’s London counterpart W1, with average asking prices of £2.08m.
The fun part of the data is looking at the highest entry outside of London. That award goes to HP9 – Beaconsfield, which resides slightly outside of the M25.
Next in line is Virginia Water, GU25, just making into the bottom of the top 20.
| # | Postcode | City/Town | Avg asking price | Average £/sqft |
| 1 | SW7 | London | 2,163,488 | 1,678 |
| 2 | W1 | London | 2,087,998 | 1,666 |
| 3 | SW3 | London | 1,673,529 | 1,736 |
| 4 | W8 | London | 1,666,738 | 1,578 |
| 5 | London | London | 1,502,436 | 1,676 |
| 6 | London | London | 1,472,981 | 1,391 |
| 7 | NW8 | London | 1,304,518 | 1,145 |
| 8 | SW10 | London | 1,253,623 | 1,266 |
| 9 | EC2 | London | 1,224,475 | 1,321 |
| 10 | W11 | London | 1,202,267 | 1,391 |
| 11 | SW13 | London | 1,159,762 | 889 |
| 12 | W2 | London | 1,062,157 | 1,262 |
| 13 | NW3 | London | 1,058,442 | 1,092 |
| 14 | HP9 | Beaconsfield | 1,048,633 | 542 |
| 15 | SW5 | London | 1,042,906 | 1,241 |
| 16 | WC1 | London | 913,070 | 1,235 |
| 17 | KT11 | Cobham | 896,266 | 535 |
| 18 | NW11 | London | 886,494 | 716 |
| 19 | SW14 | London | 878,977 | 795 |
| 20 | GU25 | Virginia Water | 878,177 | 501 |
But which postcodes are priced the highest that aren’t a stone’s throw away from the M25?
So if we look further away from London, the postcode who’s properties sell for the highest value is placed at number 65, is S022, Winchester.
The city in the county of Hampshire, resides on the edge of England’s South Downs National Park. It’s known for medieval Winchester Cathedral, with its 17th-century Morley Library, the Winchester Bible and a Norman crypt.
The next postcode outside of London, not a stone’s throw away from the M25, is OX2, Oxford, famed for its world renowned University.
| # | Postcode | City/Town | Avg asking price | Average £/sqft |
| 50 | N14 | London | 673,607 | 565 |
| 51 | TW11 | Teddington | 669,981 | 671 |
| 52 | NW7 | London | 669,189 | 572 |
| 53 | SW18 | London | 664,622 | 768 |
| 54 | HP16 | Great Missenden | 662,710 | 432 |
| 55 | N3 | London | 654,962 | 619 |
| 56 | N10 | London | 653,774 | 704 |
| 57 | RG10 | Waltham Saint Lawrence | 652,809 | 451 |
| 58 | SW4 | London | 648,888 | 808 |
| 59 | SW12 | London | 648,326 | 784 |
| 60 | TW1 | Twickenham | 646,762 | 731 |
| 61 | SW15 | London | 645,725 | 739 |
| 62 | SL5 | Ascot | 644,067 | 461 |
| 63 | SO22 | Winchester | 642,223 | 424 |
| 64 | CM4 | Ingatestone | 642,021 | 454 |
| 65 | IG4 | London | 642,000 | 424 |
| 66 | KT2 | London | 641,983 | 654 |
| 67 | N2 | London | 637,374 | 696 |
| 68 | SW19 | London | 635,540 | 699 |
| 69 | W5 | London | 632,827 | 716 |
| 70 | SE22 | London | 630,621 | 710 |
Where is the cheapest place to buy?
So where in the country can you pick up the cheapest properties? Middlesborough, Bradford and Sunderland pose the cheapest opportunities for property purchases.
Interestingly, these 3 postcodes are in the top four of the best rental yield locations.
| # | Postcode | City/Town | Avg asking price |
| 1 | TS1 | Middlesbrough | 54,978 |
| 2 | BD1 | Bradford | 58,673 |
| 3 | SR1 | Sunderland | 65,478 |
| 4 | DN31 | Grimsby | 71,105 |
| 5 | DL4 | Shildon | 73,637 |
| 6 | TS3 | Middlesbrough | 80,958 |
| 7 | SR8 | Peterlee | 85,274 |
| 8 | DH9 | Stanley | 91,391 |
| 9 | BB11 | Lancashire | 91,516 |
| 10 | L20 | Liverpool | 91,793 |
| 11 | BD21 | Keighley | 91,833 |
| 12 | CH41 | Birkenhead | 91,885 |
| 13 | HU9 | Kingston upon Hull | 92,755 |
| 14 | SR5 | Sunderland | 93,222 |
| 15 | DL17 | Ferryhill | 95,380 |
| 16 | FY1 | Blackpool | 95,526 |
| 17 | HU3 | Hull | 97,043 |
| 18 | DN32 | Grimsby | 97,652 |
| 19 | L5 | Liverpool | 97,744 |
| 20 | TS25 | Seaton Carew | 100,603 |
Lowest place on average to rent
On the flip side, the below table shows you where the cheapest place on average to rent a property important whether you’re a student or a usual renter
The DL postcodes dominate proceedings, with Shilton, Ferryhill, Bishop Auckland and Willington towns providing the cheapest rental property locations in England.
| # | Postcode | City/Town | Avg rent pcm |
| 1 | DL4 | Shildon | 376 |
| 2 | DL17 | Ferryhill | 377 |
| 3 | DL14 | Bishop Auckland | 377 |
| 4 | DL15 | Willington | 387 |
| 5 | BB11 | Lancashire | 394 |
| 6 | BD21 | Keighley | 395 |
| 7 | HU3 | Hull | 399 |
| 8 | YO15 | Bridlington | 404 |
| 9 | TS24 | Hartlepool | 409 |
| 10 | TS27 | Hartlepool | 410 |
| 11 | TS26 | Hartlepool | 410 |
| 12 | NE63 | Ashington | 413 |
| 13 | DH9 | Stanley | 414 |
| 14 | DN1 | Doncaster | 416 |
| 15 | NE24 | Blyth | 416 |
| 16 | DH5 | NE24 | 419 |
| 17 | DN15 | Scunthorpe | 421 |
| 18 | BD7 | Bradford | 424 |
| 19 | CF44 | Wales | 426 |
| 20 | TS25 | Seaton Carew | 428 |
Where are the highest volume of sales?
Operating in an area where there is a high volume of sales is a great advantage to estate agents.
More sales results in more commission. The below table shows the top 20 areas where the most sales take place on average, within a given month.
Croydon is the biggest hotspot for sales, with 71 sales per month, with NG5 – Nottingham and BN3 – Hove tied in 2nd place with 65 sales per month.
| # | Postcode | City/Town | Sales per month |
| 1 | CR0 | Croydon | 71 |
| 2 | NG5 | Nottingham | 65 |
| 3 | BN3 | Hove | 65 |
| 4 | LE2 | Leicester | 63 |
| 5 | CF14 | Cardiff | 59 |
| 6 | LE3 | Leicester | 58 |
| 7 | BS16 | Bristol | 58 |
| 8 | BN1 | Brighton | 58 |
| 9 | NG17 | Sutton-in-Ashfield | 57 |
| 10 | BN2 | Brighton | 57 |
| 11 | TQ12 | Newton Abbot | 55 |
| 12 | PR2 | Preston | 54 |
| 13 | CV6 | Coventry | 54 |
| 14 | SL6 | Maidenhead | 54 |
| 15 | NN3 | Northampton | 53 |
| 16 | BB5 | Accrington | 52 |
| 17 | LE67 | Coalville | 52 |
| 18 | NG16 | Langley Mill | 51 |
| 19 | LN6 | Lincoln | 51 |
| 20 | LE9 | Barwell | 51 |

0 Comments